Assessing the Environmental Impact of Different Propulsion Technologies
Contentious debates obscure the truth behind the environmental impact of electric vehicles (EVs). Misinformation persists despite EVs becoming commonplace on U.S. and Canadian roads. It’s time to parse the most important factors in a car’s carbon footprint and discover if an EV or an internal combustion engine (ICE) is better for the planet.
Breaking Down the Key Factors
These are the most crucial elements to consider when analyzing a car’s mark on the climate.
Manufacturing

Most of an EV’s carbon footprint comes from manufacturing processes, before the vehicle ever reaches the customer. Mining, metal processing and battery creation are energy-intensive and carbon-emitting. When making an EV, these processes produce more carbon than gas-powered car manufacturing, and this can only change if battery composition advances.
Emissions are also analyzed on a facility-to-facility basis. Energy-efficient factories will naturally have a lower carbon footprint, whether it produces EVs or ICEs. A manufacturer’s expenditure, thermal management and lighting power densities contribute. Consumers can verify required state codes based on national and global recommendations like the International Energy Conservation Code and ASHRAE 90.1.
Batteries
EVs predominantly have lithium-ion batteries, though many researchers are seeking alternatives with less heavy metals. Reliance on nickel, lithium, cobalt and more makes the battery account for 40%-60% of an EV’s embodied emissions. ICEs avoid this impact altogether.
EVs produce zero tailpipe emissions, but building battery-recycling infrastructure would drop the overall emission number. Scaling this is vital for eliminating one of the most glaring offenses of EV production.
Operational Emissions
ICE cars and trucks are one of the main contributors to carbon dioxide in the atmosphere. In contrast, EVs have fewer components, which reduces their maintenance needs. In use emissions inherently are lower in an EV since they eliminate oil changes, among other common ICE maintenance and repairs.

Electricity Source
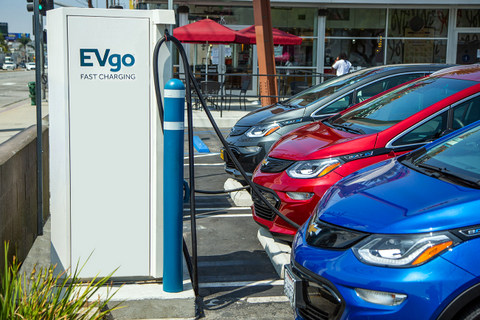
Many EV chargers run on renewable energy. However, some still pull from fossil fuel-based sources like coal and natural gas, calling their eco-friendliness into question.
Stations relying on wind, solar, geothermal or other green sources have a nearly net-zero impact. Charging at different times of day can also change carbon emissions given how much stress charging puts on the grid and what the source of electricity is at a given time.
Life Cycle Emissions
A vehicle’s carbon footprint continues to accumulate as people drive. Life cycle emissions rise based on a few factors.
Fuel type is one of the most important, giving EVs the obvious advantage since they don’t burn GHG producing fossil fuels. EVs need to drive for around 13,500 miles to outperform a gas-powered car. This demonstrates how quickly an EV overcomes the carbon debt it acquired during production throughout its life cycle.
Geography and energy infrastructure can cause this variable to change between regions. The available energy mix can make driving worse or better, as each power source carries different environmental consequences.
Summarizing Emissions
The major categories reveal why confusion may arise when comparing EVs and ICEs. EVs objectively have a lower carbon footprint overall, but gas cars win if observers only look at a few select phases. These numbers represent global metric tons of carbon dioxide as of 2023, according to the International Energy Agency.
| Emission category | EV | ICE |
| Car production | 3.3 | 3.7 |
| Battery production | 5.3 | 0 |
| Well-to-tank (upstream fuel emissions) | 14.5 | 11.5 |
| Tank-to-wheel (operational power source emissions) | 0 | 30.9 |
| Life cycle emissions totals | 23.1 | 46.1 |
| Possible grid decarbonization impact | 4.8 | 0 |
The Proof Is in the Emissions
While EVs have a higher initial carbon footprint due to materials sourcing and manufacturing, they typically make up for it with lower operational emissions over their life span. The overall environmental benefit of EVs is greatest when renewable energy sources power them.
The post From Tailpipe to Battery: The True Carbon Footprint of Electric Vehicles vs. Gas Cars first appeared on Clean Fleet Report.

